How’s The Market? August 2021 Update
July and August are, as usual, the most confusing months in the real estate year!
Vacations continue, many buyers take a break and agents too may leave town.
The perennial question is, “Is this a seasonal lull or is the market slowing?”
Homes with the widest appeal are continuing to set record sales, and other perfectly fine properties may sit on the sidelines a little longer as players take a breather.
Inventory continues to be low, and mortgage rates are still extremely low. A buyer right now is best served by knowing their top must haves, acting fast on homes they love, and remaining calm. They are benefited by working with a strong agent who knows the landscape well and will work quickly in their best interests.
Not making assumptions about the list price is key — we have underpricing, overpricing and prices the seller will accept!
Here are a few charts and additional data particularly on the higher end of the market is in the link below.
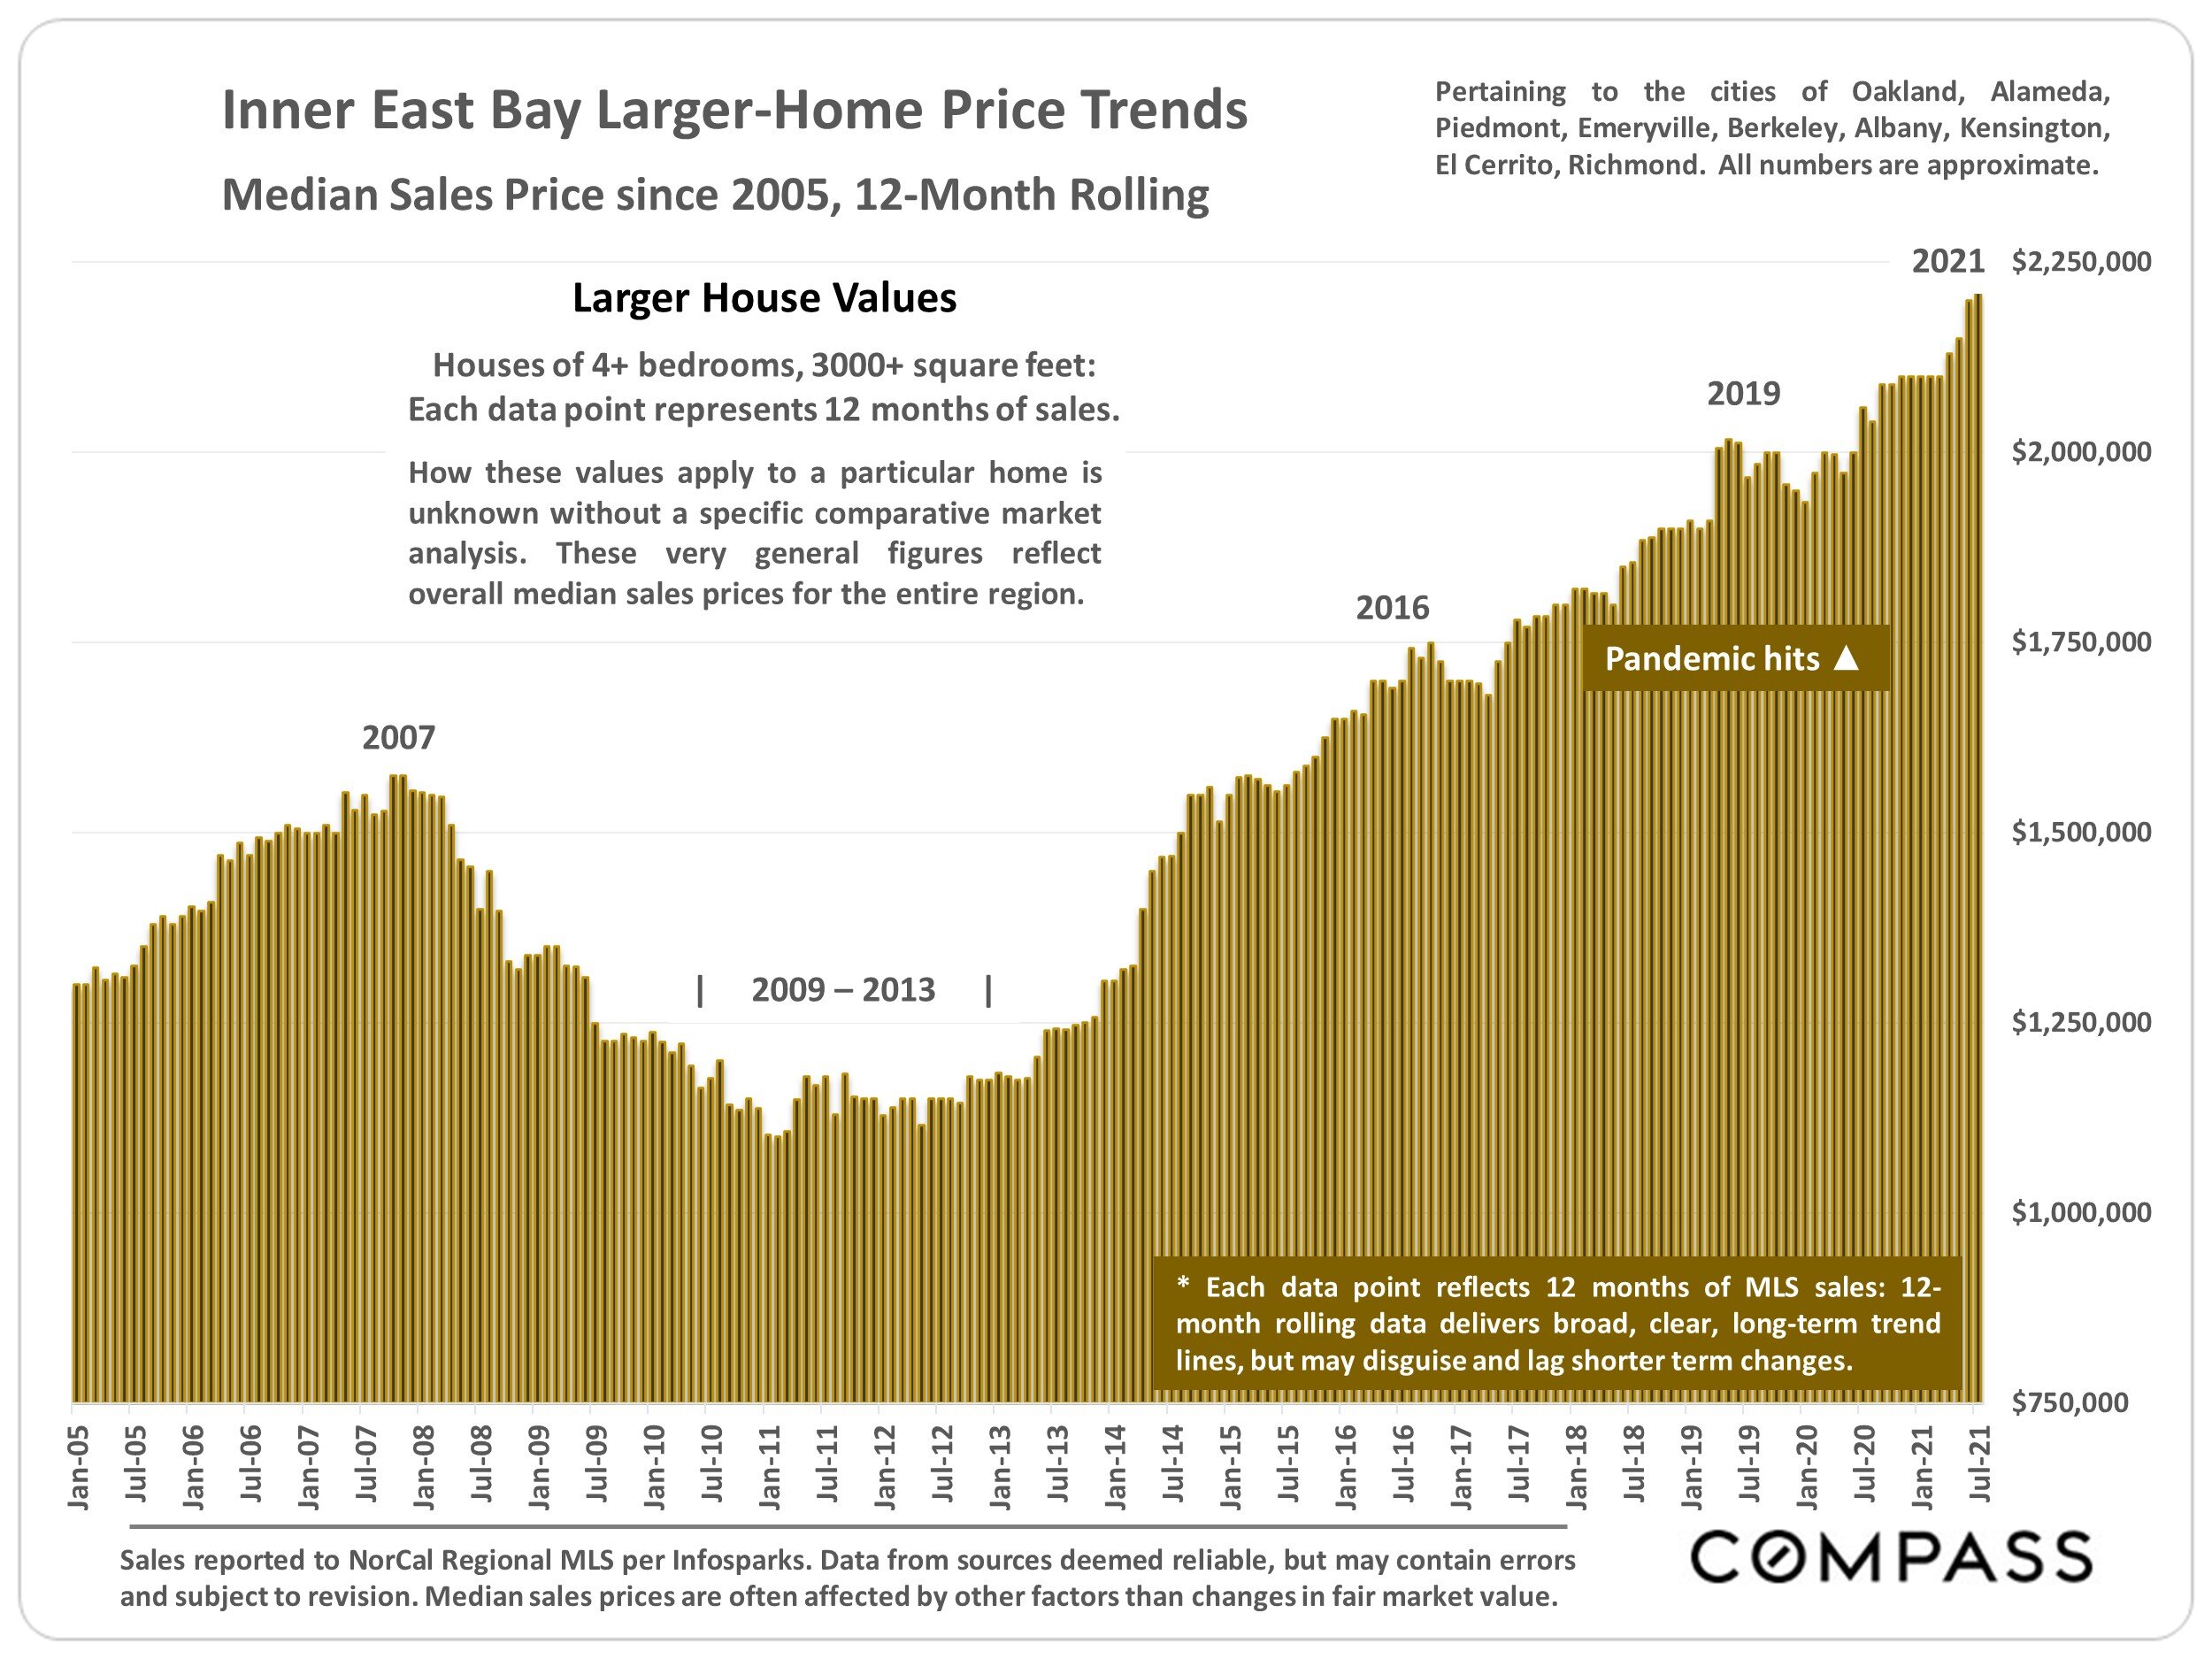
This report looks at median home sales prices for the region as a whole and references Oakland, Piedmont, Alameda, Berkeley, Albany, Kensington, El Cerrito, and Richmond.
In the first 6 months of 2021, $9.5 billion in home sales were reported to MLS in Alameda County, 41% above the previous peak in 2018.
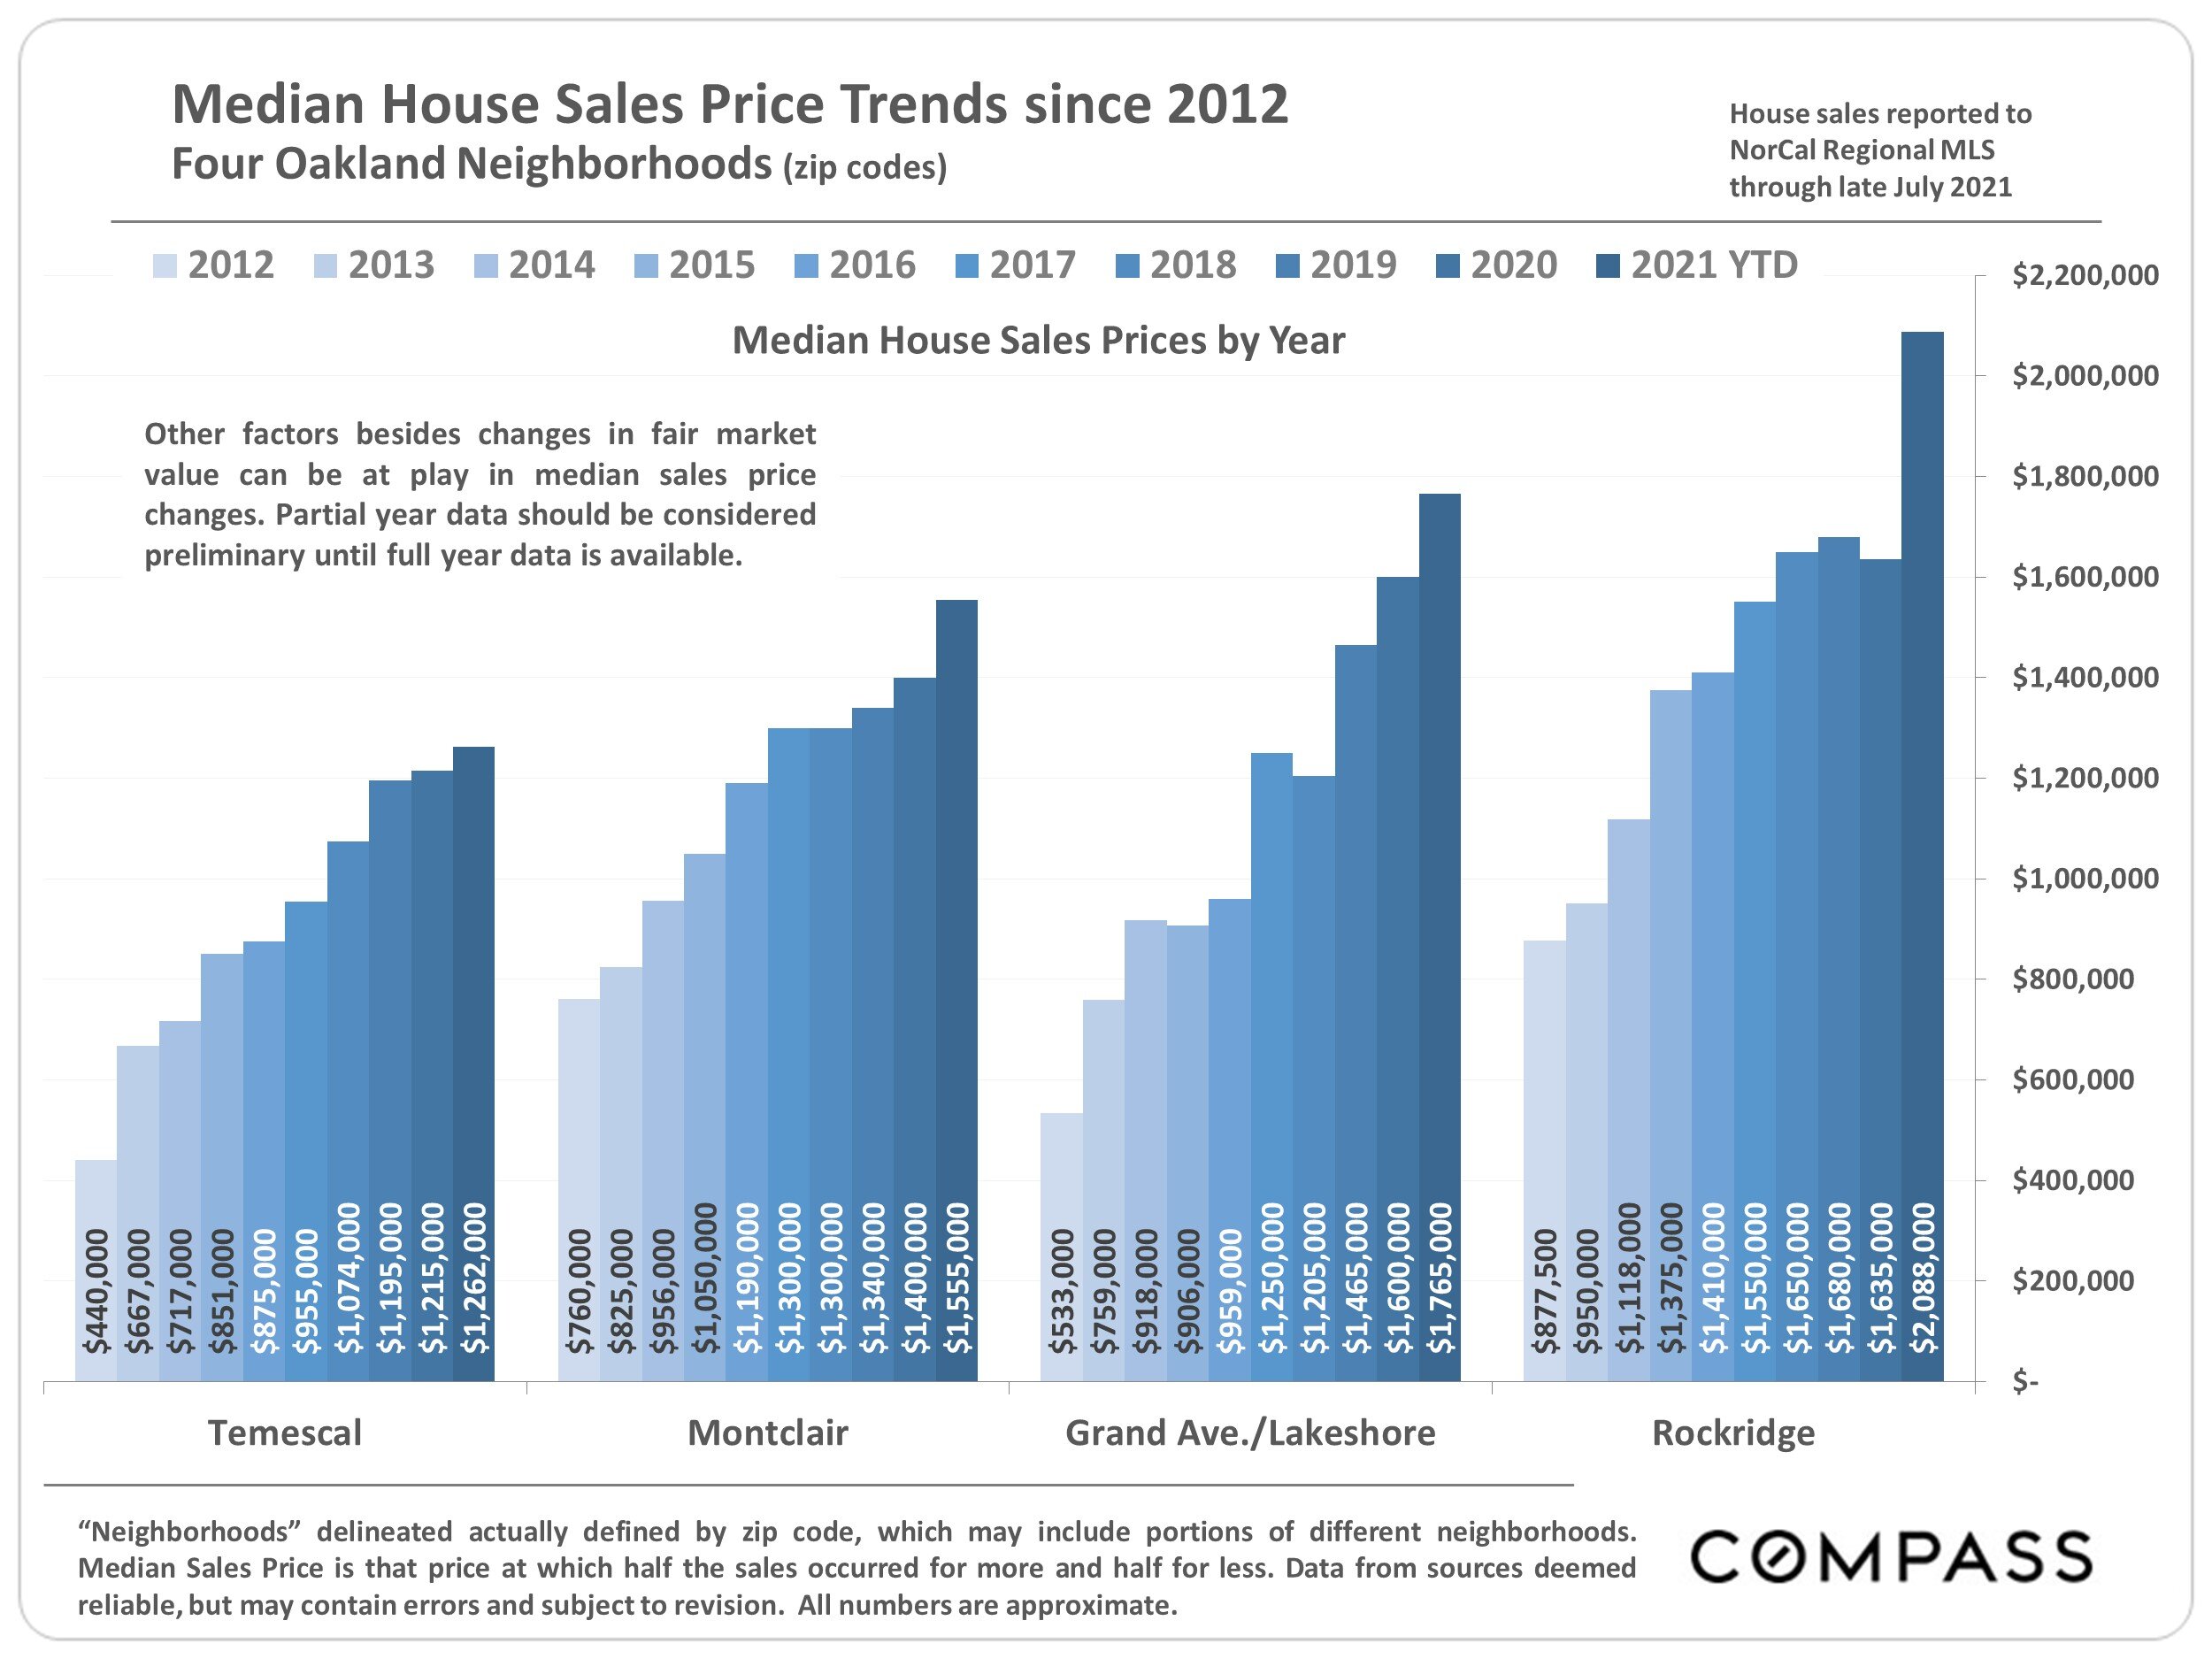
Here’s a look at median home sale prices through late July in select Oakland neighborhoods: Temescal, Montclair, Grand Ave/Lakeshore, Rockridge. Compared to last July, Rockridge has gone up the most, from a median home price of $1,635,000 to 2,088,000.
Larger home values in the Inner East Bay are at an all-time high. The 12-month median sale price as of August 2021 was higher than all previous years, reaching above $2,000,000.
Typically, the market ebbs and flows by season, though the pandemic upended normal trends in 2020. In summer 2021, activity (new listings, offers being accepted) began to decline from the June peak, possibly a reversion to seasonal norms — though the number of listings going into contract in July remained higher than the typical summers (2018, 2019).
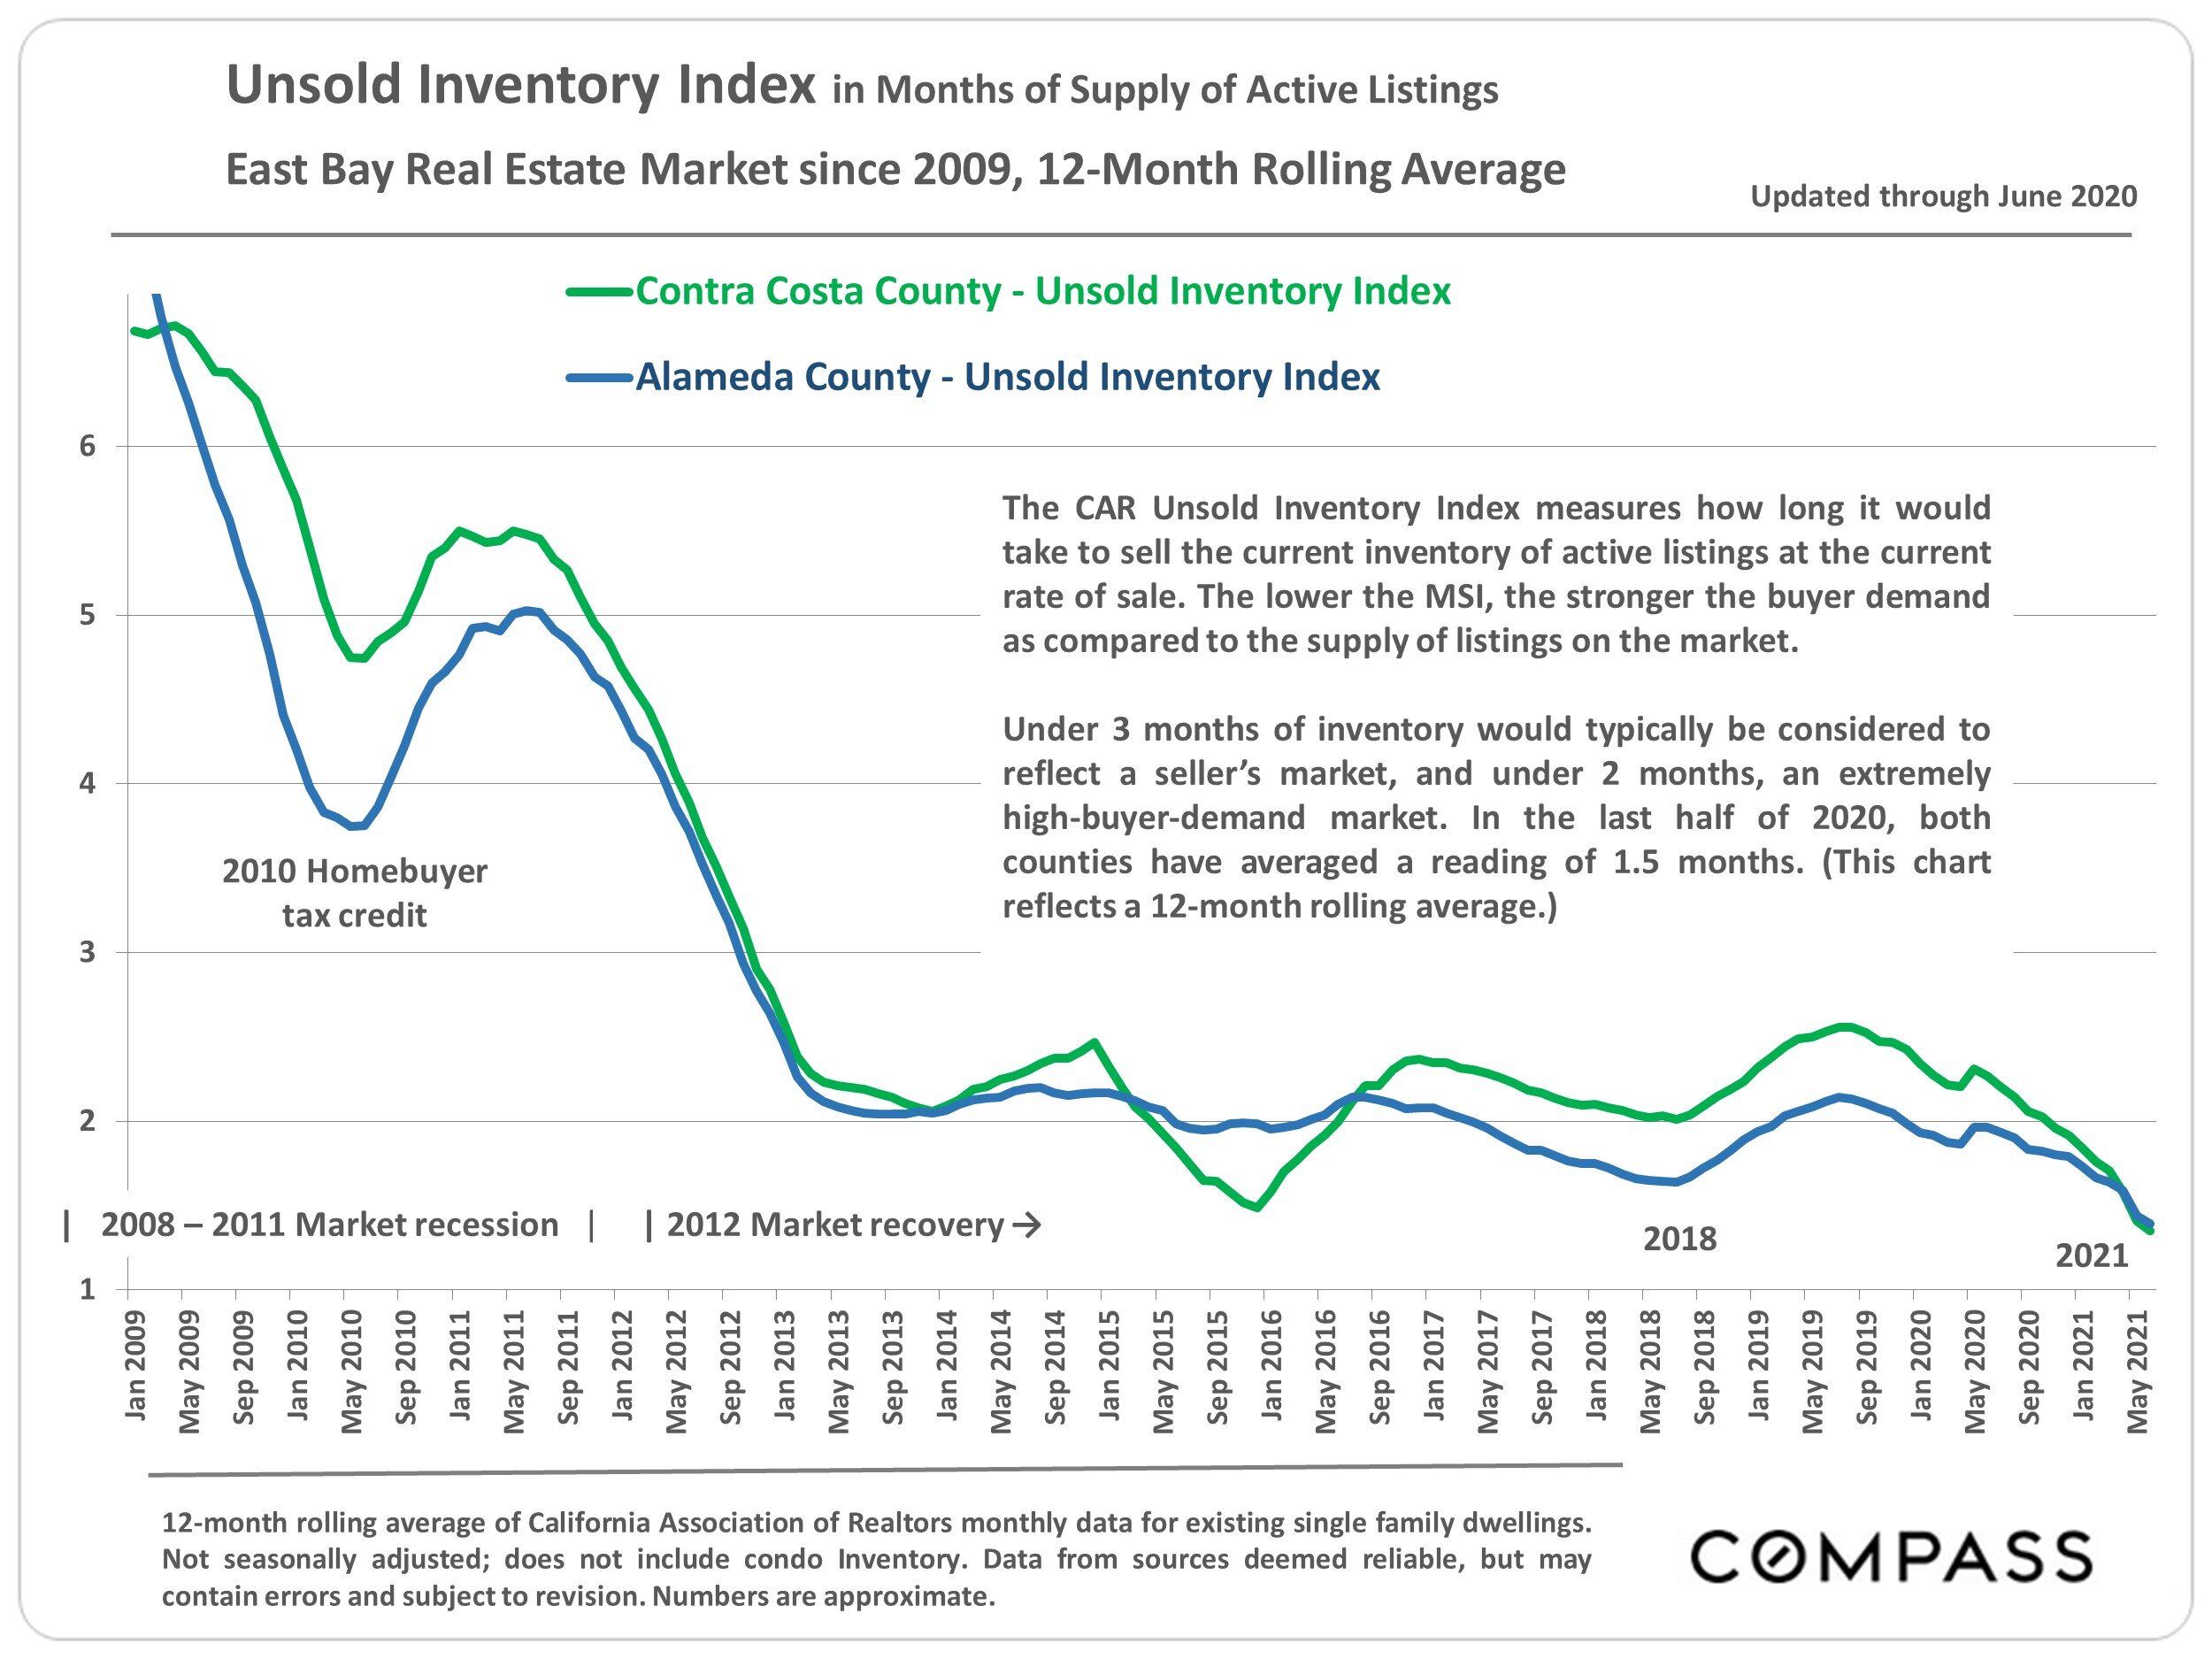
The CAR Unsold Inventory Index measure how long it would take to sell the current inventory of active listings at the current rate of sale. The lower the MSI, the stronger the buyer demand as compared to supply of listings on the market.
Under 3 months of inventory would typically be considered to reflect a seller’s market, and under 2 months, an extremely high-buyer-demand market. In the last half of 2020, both Alameda County and Contra Costa County have averaged a reading of 1.5 months.
Per Freddie Mac, on August 5, 2021, the weekly average interest rate for a 30-year fixted-rate mortgage was 2.77%, slightly above its nadir in Januarage (2.65%), and the 15-year rate was at a historic low at 2.1%. In November 2018, the 30-year rate hit 4.94%, and in 2007, it was 6.3%.
More market update data from Compass can be found here.


